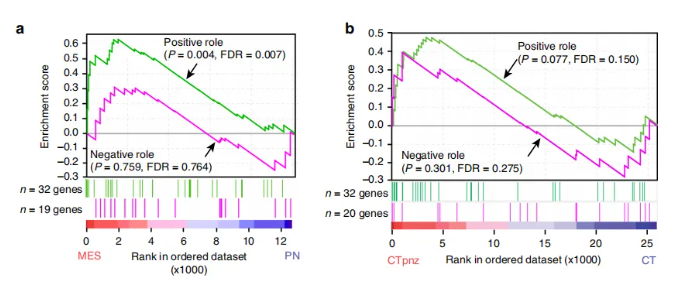
基因集富集分析(Gene Set Enrichment Analysis, GSEA)是生物信息学领域用于解析基因表达数据的重要方法,其核心功能是评估特定基因集在不同生物学状态或表型中的整体表达变化模式,并通过统计学检验揭示基因集的富集显著性。
GSEA叠图作为该方法的关键可视化工具,不仅能直观呈现基因集的富集程度,清晰展示基因集在样本中的整体表达趋势,还可通过多维度对比,便捷地揭示不同基因集或表型间的富集差异,为科研成果提供创新性的展示视角。
下图为发表于nature communications的研究论文“Neutrophil-induced ferroptosis promotes tumor necrosis in glioblastoma progression”中呈现的GSEA叠图。本文将详细解析GSEA叠图的绘制流程与关键要点。

#加载R包
library(clusterProfiler)
library(enrichplot)
library(dplyr)
library(ggrepel)
library(ggplot2)
library(RColorBrewer)
library(gridExtra)
library(cowplot)
#准备输入数据,需要基因名和log2FoldChange
mycol <- c("#223D6C","#D20A13","#088247","#58CDD9","#7A142C","#5D90BA","#431A3D","#91612D","#6E568C","#E0367A","#D8D155","#64495D","#7CC767")
genes_fc <- read.table("genes_fc_results.xls", header = T)
#整理进行富集的数据
gene_id <- bitr(genes_fc$SYMBOL, fromType = "SYMBOL", toType = "ENTREZID", OrgDb = "org.Hs.eg.db")
fc_id <- merge(genes_fc, gene_id, by="SYMBOL", all=F)
fc_id <- fc_id="">% distinct(SYMBOL, .keep_all = TRUE)
fc_id_sort <- fc_id[order(fc_id$log2FoldChange, decreasing = T),]
input_fc <- fc_id_sort$log2FoldChange
names(input_fc) <- fc_id_sort$ENTREZID
#富集并选择关注的通路,输出富集结果
kresult <- gseKEGG(input_fc,pvalueCutoff = 1, organism = "hsa")
kresult2 <- setReadable(kresult, 'org.Hs.eg.db', 'ENTREZID')
sortkk <- kresult2[order(kresult2$enrichmentScore, decreasing = T),]
write.csv(sortkk,"gsea_KEGG_output.csv", quote = F, row.names = F)
geneSetID <- c("hsa00592", "hsa00531","hsa00565")
for (i in geneSetID) {
gseaplot(kresult, i)
genelist <- enrichplot:::gsInfo(kresult, i)
genelist$x <- fc_id_sort$SYMBOL
names(genelist)[1] <- "SYMBOL"
write.csv(genelist, paste0(i, ".csv"),row.names = F)
}
#准备画图数据
x <- kresult
geneList <- position <- NULL ## to satisfy codetool
conbind_data <- do.call(rbind, lapply(geneSetID, enrichplot:::gsInfo, object = x))
conbind_data$SYMBOL <- rep(fc_id_sort$SYMBOL,3)
#画第一部分:ES 折线图(富集分数)
p <- ggplot(conbind_data, aes_(x = ~x)) + xlab(NULL) +
geom_line(aes_(y = ~runningScore, color= ~Description), size=1) +
scale_color_manual(values = mycol) +
geom_hline(yintercept = 0, lty = "longdash", lwd = 0.2) +
ylab("Enrichment\n Score") +
theme_bw() +
theme(panel.grid = element_blank()) +
theme(legend.position = "top", legend.title = element_blank(),
legend.background = element_rect(fill = "transparent")) +
theme(axis.text.y=element_text(size = 12, face = "bold"),
axis.text.x=element_blank(),
axis.ticks.x=element_blank(),
axis.line.x=element_blank(),
plot.margin=margin(t=.2, r = .2, b=0, l=.2, unit="cm"))
#画第二部分:Hits 图(基因在排序列表的排布位置)
rel_heights <- c(1.5, .5, 1.5)
i <- 0
for (term in unique(conbind_data$Description)) {
idx <- which(conbind_data$ymin != 0 & conbind_data$Description == term)
conbind_data[idx, "ymin"] <- i
conbind_data[idx, "ymax"] <- i + 1
i <- i + 1
}
p2 <- ggplot(conbind_data, aes_(x = ~x)) +
geom_linerange(aes_(ymin=~ymin, ymax=~ymax, color=~Description)) +
xlab(NULL) + ylab(NULL) +
scale_color_manual(values = mycol) +
theme_bw() +
theme(panel.grid = element_blank()) +
theme(legend.position = "none",
plot.margin = margin(t=-.1, b=0,unit="cm"),
axis.ticks = element_blank(),
axis.text = element_blank(),
axis.line.x = element_blank()) +
scale_y_continuous(expand=c(0,0))
#第三部分画基因排序值分布图,并标注感兴趣的基因
df2 <- p$data
df2$y <- p$data$geneList[df2$x]
df2$SYMBOL <- p$data$SYMBOL[df2$x]
choose_genes <- c("PLA2G4A","PLA2G1B","PLA2G4C","SPAM1","CEPT1")
choosegenes <- data.frame(SYMBOL = choose_genes)
choosegenes <- merge(choosegenes, df2, by = "SYMBOL")
choosegenes <- choosegenes[choosegenes$position == 1,]
#组图
plotlist <- list(p, p2, p3)
n <- length(plotlist)
plotlist[[n]] <- plotlist[[n]] +
theme(axis.line.x = element_line(),
axis.ticks.x = element_line(),
axis.text.x = element_text(size = 12, face = "bold"))
p4 <-plot_grid(plotlist = plotlist, ncol = 1,, rel_heights = rel_heights)
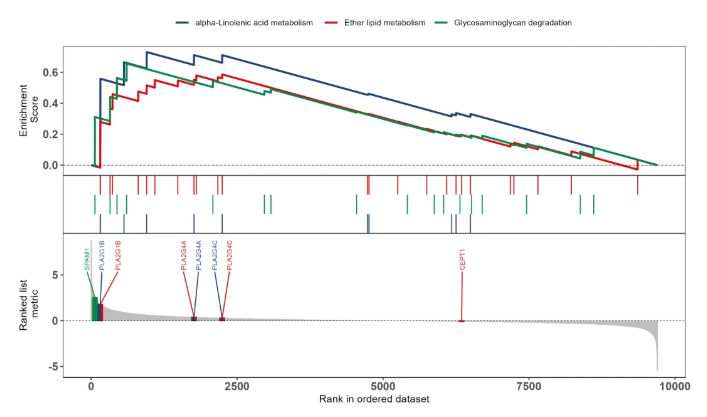
结果如下图所示

如此,就能把关注的通路整合到一张图里展示,还能标注通路中的关键基因~赶紧动手尝试一下,直观看看基因集的富集情况吧!